
Table 5: Direct state cultural expenditure by sector, in million EUR, 2008-2009*
| Domain | Direct expenditure (Ministry of Culture budget) | ||||
|---|---|---|---|---|---|
| 2005 | 2006 | 2007 | 2008 | 2009 | |
| Cultural Heritage | 109.4 | 92.7 | 86.2 | 83.1 | 82.2 |
| Archives and Libraries | 35.0 | 32.2 | 28.3 | 29.7 | 29.4 |
| Visual and Performing Arts | 79.9 | 86.5 | 83.8 | 86.8 | 47.4 |
| Cinema, Audiovisual and Multimedia | 25.2 | 22.3 | 21.6 | 20.1 | 20.6 |
| Socio-cultural Activities | 35.6 | 26.8 | 22.7 | 26.8 | 33.1 |
| TOTAL | 285.1 | 260.5 | 242.6 | 246.5 | 212.7 |
Source(s):
Ministry of Culture / Secretaria Geral.
Note:
* See also chapter 1.2.1.
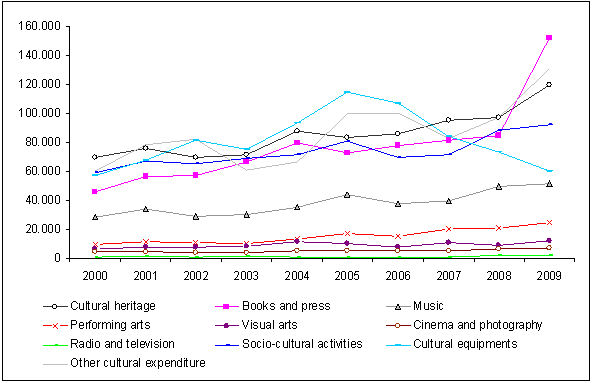
Figure 5 illustrates the evolution of local authority expenditure by cultural sub domain. Over this period, expenditures increased in all cultural domains (despite since 2005 the downward trend in the expenditure on Cultural Equipment), especially those related with Cultural heritage and Books and Press.Figure 5: Local authority expenditure by cultural sub domain, in thousand EUR, 2000-2009
Figure 5: Local authority expenditure by cultural sub domain, in thousand EUR, 2000-2009
Source:
OAC from INE, Estatísticas da Cultura, Desporto e Recreio (http://www.ine.pt/).
Chapter published: 13-07-2011
Comments are closed.