
Local government expenditure on culture surpassed central administrations by the mid-1990s. Since then this trend has became more apparent and the gap between both levels of government widened.
Table 4: Public cultural expenditure: by level of government, in million EUR, 2009
| Level of government | Total expenditure | % of total |
|---|---|---|
| State (federal) | 238.0 | 27% |
| Regional (provincial, Länder) | —- | —- |
| Local (municipal) | 649.7 | 73% |
| Total | 887.7 | 100.0% |
Source:
OAC from INE, Estatísticas da Cultura, Desporto e Recreio [for Local (Municipal)] and Ministry of Finances / DGO, Conta Geral do Estado [for State (federal)].
Notes:
i) Expenditure figures regarding autonomous regions of the Azores and Madeira are not available.
ii) Total Expenditure of the State (federal) only refers to continental territory.
iii) Public cultural expenditure by sector is only available with separated figures for each level (state and local authority).
iv) Percentages only indicate the approximate values.
Figure 3: State expenditure on culture, in million EUR and %, 2000-2009
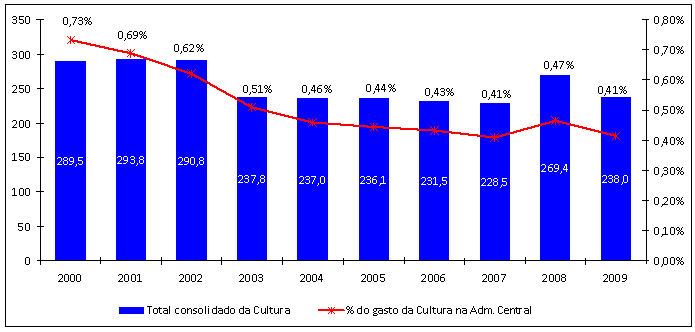
Source: OAC from MFAP / DGO, CGE.
As Figure 4 shows, there was, however, a slight drop in local authority expenditure on culture for the year 2006, as well as an increase in 2005, 2008 and 2009.
Figure 4: Local government spending on culture, in thousand EUR, 2000-2009
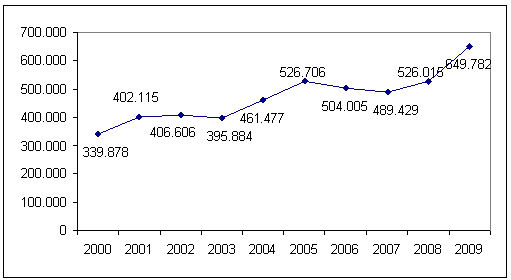
Source: OAC from INE, Estatísticas da Cultura, Desporto e Recreio (http://www.ine.pt/).
Comments are closed.