
In 2024, Lithuania’s GDP at current prices was 77.94 billion EUR, and GDP per capita at current prices was 27 150 EUR (data from World Bank Group). In 2023, Lithuania’s GDP at current prices was 73.8 billion EUR, and GDP per capita at current prices was 25 700 EUR. Total general government expenditure was 30.99 billion EUR in 2024, and 27.58 billion EUR in 2023. Public expenditure on recreation, culture and religion* at all levels of government in 2023 was 912.8 million EUR. The central government’s share of expenditure was 465.1 million EUR, and the share of local governments was 447.7 million EUR. Public expenditure on recreation, culture and religion as a percentage of the total public expenditure was 3.3 %, and as a percentage of GDP was 1.2 %. Public expenditure on recreation, culture and religion per capita was 326 EUR.
Figure 4. General government expenditure in Lithuania in 2023
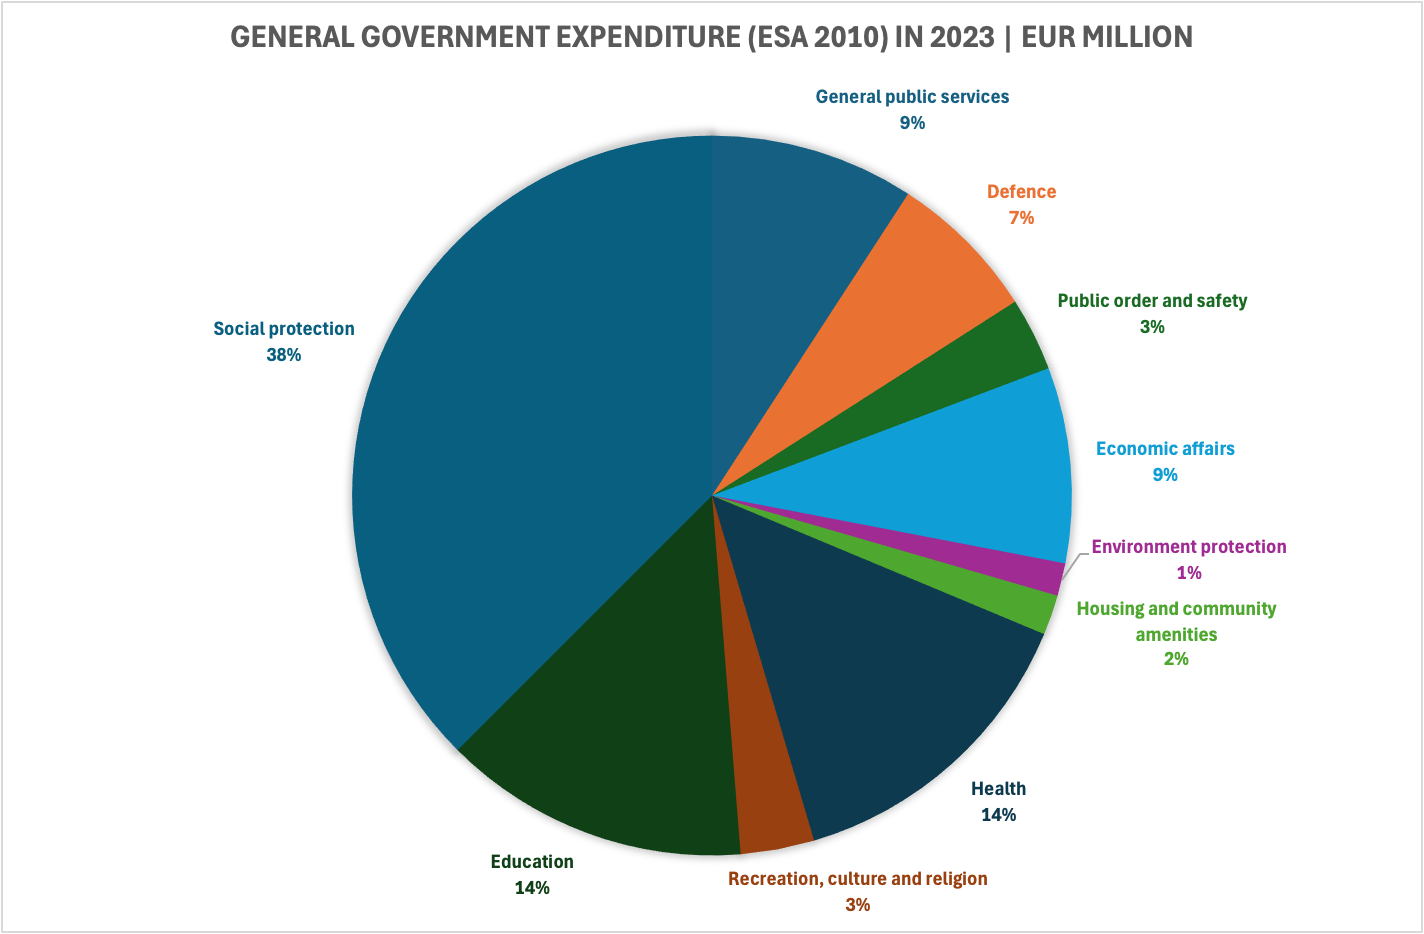
Source: Official Statistics Portal
*Public expenditure on culture (ESA 2010) comprises data of the indicator CG080 “recreation, culture and religion” as it is presented in the database of the Lithuanian State Data Agency and Eurostat according to the COFOG 1999.
Over the last five years, the total public expenditure on recreation, culture and religion has been gradually increasing. Consequently, per capita cultural expenditure has also increased, both as a result of increasing appropriations for culture and population decline. The share in GDP of expenditure for culture has not changed substantially since 2015 to 2019, and was about 1% of GDP. In 2020, it increased to 1.4 %, but in 2021 decreased to 1.2% of GDP and remained at the same level till 2023.
Table 37: GDP and public expenditure on culture in 2015–2023
|
|
2015 |
2016 |
2017 |
2018 |
2019 |
2020 |
2021 |
2022 |
2023 |
|
GDP at current prices, in millions EUR |
37 345 |
38 889 |
42 276 |
45 514 |
48 859 |
49 507 |
56 679 |
67 455 |
73 792 |
|
GDP per capita at current prices, EUR |
12 884 |
13 486 |
14 796 |
16 157 |
17 486 |
17 710 |
20 180 |
23 820 |
25 700 |
|
Public expenditure on culture (all levels), in millions EUR |
351.7 |
397.4 |
453.8 |
499.9 |
570.8 |
701.9 |
672.1 |
820.6 |
912.8 |
|
Public expenditure on culture (all levels) in percentage of the total public expenditure in that year |
2.7 % |
3.0 % |
3.2 % |
3.2 % |
3.3 % |
3.3 % |
3.2 % |
3.4 % |
3.3% |
|
Public expenditure on culture per capita, in EUR |
121 |
139 |
158 |
178 |
204 |
250 |
240 |
292 |
326 |
|
Public expenditure on culture in percentage of the GDP |
0.9 % |
1.0 % |
1.1 % |
1.1 % |
1.1 % |
1.4 % |
1.2 % |
1.2 % |
1.2 % |
Source: Eurostat
Comments are closed.