
Table 5: Household cultural expenditure in Millions of Euros by expenditure purpose, 2020 – 2016
| Item | Audio-visual, photographic and information processing equipment | Other major durables for recreation and culture | Recreational and cultural services | Books | Newspapers and stationery | Total | |
| 2020 | Total Expenditure | 8,503 | 2,925 | 19,337 | 3,164 | 5,345 | 39,274 |
| % of total | 21.7 | 7.4 | 49.2 | 13.6 | 100.0 | ||
| 2019 | Total Expenditure | 8,419 | 2,849 | 30,473 | 3,435 | 5,768 | 50,944 |
| % of total | 16.5 | 5.6 | 59.8 | 6.7 | 11.3 | 100.0 | |
| 2018 | Total Expenditure | 8,375 | 2,950 | 29,674 | 3,481 | 5,638 | 50,118 |
| % of total | 16.7 | 5.9 | 59.2 | 6.9 | 11.2 | 100.0 | |
| 2017 | Total Expenditure | 8,260 | 2,816 | 29,438 | 3,385 | 5,695 | 49,595 |
| % of total | 16.7 | 5.7 | 59.4 | 6.8 | 11.5 | 100.0 | |
| 2016 | Total Expenditure | 7,681 | 2,719 | 29,145 | 3,348 | 5,694 | 48,587 |
| % of total | 15.8 | 5.6 | 60.0 | 6.9 | 11.7 | 100.0 | |
| var 2020/2019 | 1.0 | 2.7 | -36.5 | -7.9 | -7.3 | -22.9 | |
| Var 2020/2016 | 10.7 | 7.6 | -33.7 | -5.5 | -6.1 | -19.2 |
In 2020, Italian household cultural expenditure was 39,274 million Euros, the lowest since 1999. Almost half of the expenditure (49.2%) is due to recreation and cultural services, followed by audio-visual, photographic and information processing equipment (21.7%). In general, these two items are those on which Italian households spend the largest share of their cultural expenditure.
The total household expenditure in 2020 decreased by around 23% as compared to 2019 and by nearly 19% when considering 2016. Due to the exceptional conditions of the pandemic, with the venue-based cultural activities closed for long periods, in 2020 the expenditure on recreation and cultural services, newspapers and stationery, was dramatically lower than 2019. Compared to 2016, the 2020 expenditure in recreation and cultural services decreased by over 30%.
A possible effect of the long confinement at home is that in 2020 household expenditure on audio-visual, photographic and information processing equipment and on other major durables for recreation and culture maintained the growth recorded in the previous years.
Figure 6.3.1: Household cultural expenditure in million EUR by expenditure purpose, 2005-2020
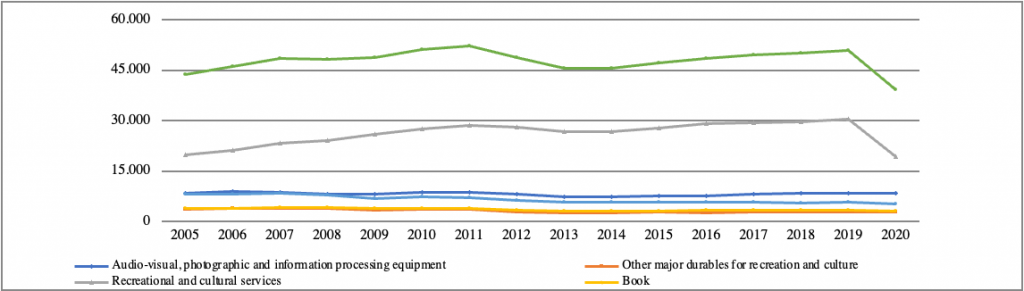
Due to the Covid-19 pandemic, as expected, household expenditure for culture reduced by about 24% when compared to 2010 and by about 10% from 2005. Over the past years, household cultural expenditure had been increasing from 43,773 million Euros in 2005 to 52,067 million Euros in 2011, to fall back to 45,583 million Euros in 2015 and then increase again in the following year until 2019, when it reached nearly 51 million Euros.
In 2020 cultural expenditure represented 4.1% of total household expenditure. Between 2012 and 2019 it fluctuated between 4.6% and 4.9%. In the last 15 years, the peak of the greatest expansion of cultural expenditure was observed between 2009 and 2011, when it reached 5.1% – 5.2%. All this denotes the marginality of cultural expenditure over total household expenditure[1].
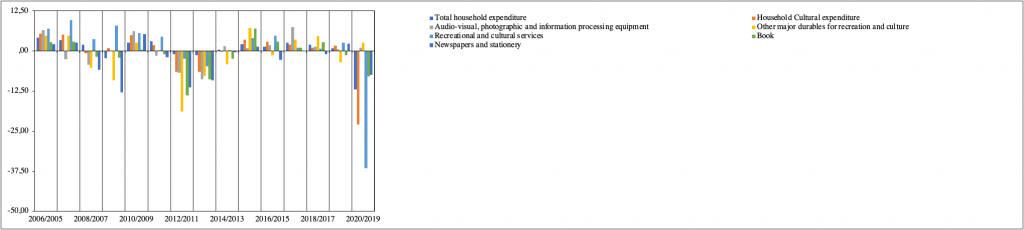
To provide a more complete picture of the characteristics of household cultural expenditure, Figure 6.3.2. shows the trend of percentage changes in total household expenditure, expenditure on culture and expenditure on culture broken down by item of expenditure.
Figure 6.3.2: Trend of percentage changes on total household expenditure, total household cultural expenditure and household cultural expenditure by purpose, 2005-2020
[1] A. Cicerchia, A. Catullo, “I consumi culturali delle famiglie” – “Household cultural consumption” in 17° Rapporto annuale Federculture 2021.
Comments are closed.